The Challenge
- Legacy workflows slowed down operations and increased delivery risk.
- User experience inconsistencies reduced engagement and completion rates.
- Reporting and visibility were fragmented across teams.
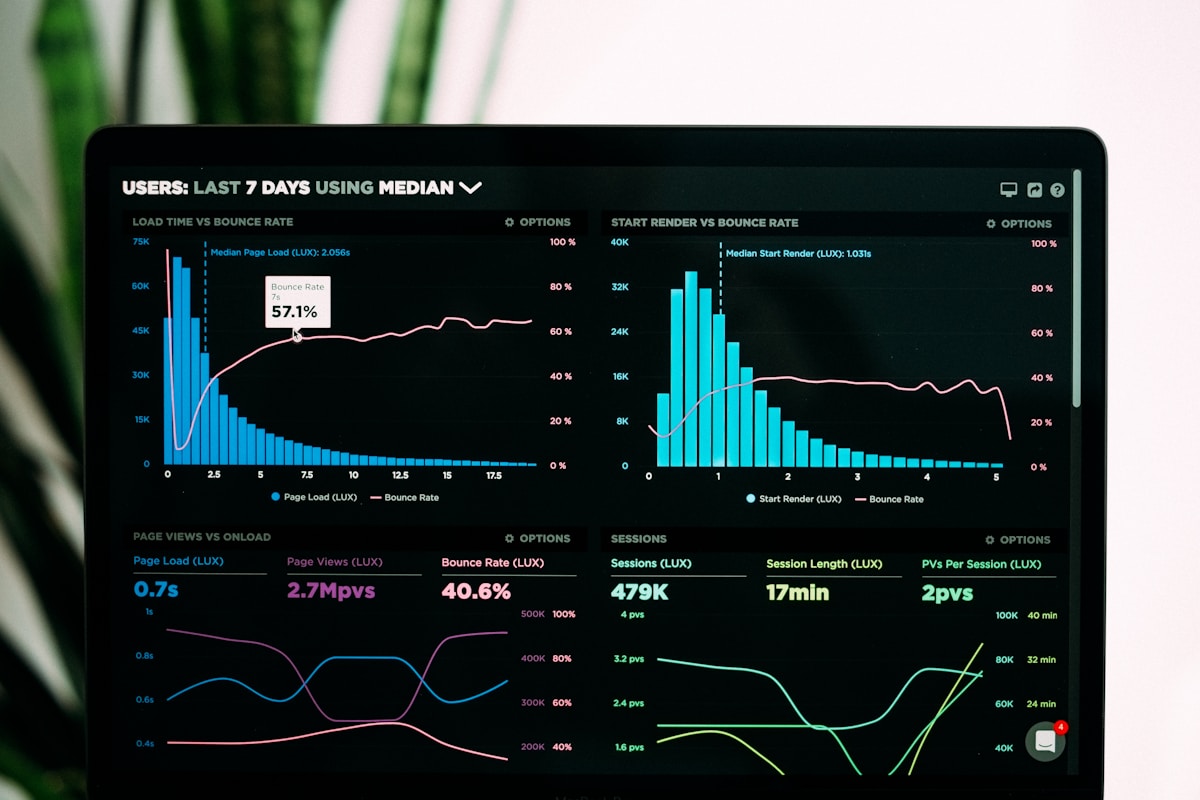
Real-time SaaS analytics web app giving small businesses actionable visibility into key metrics.

Delivered a SaaS analytics dashboard that aggregates data from multiple sources into a real-time web application, helping small businesses monitor KPIs, spot trends, and make faster, data-informed decisions.
Scope
Product strategy, design, development, QA, and launch support.
Client
Confidential Client
Audience
Business stakeholders and end users
The capabilities that make this project stand out.
Teams focus on what matters most without information overload.
Reduced manual work and fewer process bottlenecks.

Leadership gets faster insights to make confident decisions.

A structured, collaborative process designed for predictable delivery.
Step 1
Discovery and requirements alignment with stakeholders.
Step 2
UX validation and rapid iteration on core flows.
Step 3
Sprint-based implementation with continuous QA.
Step 4
Launch, monitoring, and optimization.
Chosen for scalability, security, and maintainability.
The project delivered measurable improvements in speed, reliability, and user satisfaction.
Project Sponsor
Product Lead, Client Organization
Want results like this?
Book a CallExplore more case studies from our portfolio.

High-performance e-commerce web platform redesign that improved conversion rates and checkout speed.
View Case Study
Cross-platform mobile app that automates workout, nutrition, and progress tracking for users.
View Case Study
High-conversion marketing website for a tech startup focused on lead generation and brand credibility.
View Case StudyShare your goals and constraints. We reply within 24 hours.